Scalper's Fractal Cloud with RSI + VWAP + MACD (Fixed)Scalper’s Fractal Confluence Dashboard
1. Purpose of the Indicator
This TradingView indicator script provides a high-confluence setup for scalping and day trading. It blends momentum indicators (RSI, MACD), trend bias tools (EMA Cloud, VWAP), and structure (fractal swings, gap zones) to help confirm precise entries and exits.
2. Components of the Indicator
- EMA Cloud (50 & 200 EMA): Trend bias – green means bullish, red means bearish. Avoid longs under red cloud.
- VWAP: Institutional volume anchor. Ideal entries are pullbacks to VWAP in direction of trend.
- Gap Zones: Shows open-air zones (white space) where price can move fast. Used to anticipate momentum moves.
- ZigZag Swings: Marks structural pivots (highs/lows) – useful for stop placement and range anticipation.
- MACD Histogram: Shows bullish or bearish momentum via background color.
- RSI: Overbought (>70) or oversold (<30) warnings. Good for exits or countertrend reversion plays.
- EMA Spread Label: Quick view of momentum strength. Wide spread = strong trend.
3. Scalping Entry Checklist
Before entering a trade, confirm these conditions:
• • Bias: EMA cloud color supports trade direction
• • Price is above/below VWAP (confirming institutional flow)
• • MACD histogram matches direction (green for long, red for short)
• • RSI not at extreme (unless you’re fading trend)
• • If entering gap zone, expect fast move
• • Recent swing high/low nearby for target or stop
4. Risk & Sizing Guidelines
Risk 1–2% of account per trade. Place stop below recent swing low (for longs) or high (for shorts). Use fractional sizing near VWAP or white space zones for scalping reversals.
5. Daily Trade Journal Template
- Date:
- Ticker:
- Setup Type (VWAP pullback, Gap Break, EMA reversion):
- Entry Time:
- Bias (Green/Red Cloud):
- RSI Level / MACD Reading:
- Stop Loss:
- Target:
- Result (P/L):
- What I Did Well:
- What Needs Work:
在腳本中搜尋"stop loss"

RSI + MA + Divergence + SnR + Price levelOverview
This indicator combines several technical analysis tools to give traders a comprehensive view based on the RSI indicator. Its main features include:
RSI & Moving Averages on RSI:
RSI: Calculates the RSI based on the closing price (or a user-selected source) with a configurable period (default is 14).
EMA and WMA: Computes and plots an Exponential Moving Average (EMA with a period of 9) and a Weighted Moving Average (WMA with a period of 45) on the RSI, helping to smooth out signals and better identify trends.
Price Ladder Based on RSI:
Draws horizontal lines at specified target RSI levels (from targetRSI1 to targetRSI7, default levels ranging from 20 to 80).
Calculates a target price based on the price change relative to the averaged gains and losses, providing an estimated price level when the RSI reaches those critical levels.
Divergence Detection:
Identifies divergence between price and RSI:
Bullish Divergence: Detected when the price forms a lower low but RSI fails to confirm with a corresponding lower low, with the RSI falling under a configurable threshold (d_below).
Bearish Divergence: Detected when the price forms a higher high while the RSI does not, with the RSI exceeding a configurable upper threshold (d_upper).
Optionally displays labels on the chart to alert the trader when divergence signals are detected.
Auto Support & Resistance on RSI:
Automatically calculates and plots support and resistance lines based on the RSI over different lookback periods (e.g., 34, 89, 200 bars).
Helps traders identify key RSI levels where price reversals or breakouts might occur.
Benefits for the Trader
This indicator is designed to assist traders in their decision-making process by integrating multiple technical analysis elements:
Identifying Market Trends:
By combining the RSI with its moving averages (EMA, WMA), traders can better assess market trends and the strength of these trends, thereby improving trade entry accuracy.
Early Reversal Signals via Divergence:
Divergence signals (both bullish and bearish) can help forecast potential reversals in the market, allowing traders to adjust their strategies timely.
Determining RSI-Based Support/Resistance Levels:
Automatic identification of support and resistance levels on the RSI provides key areas where a price reversal or breakout may occur, assisting traders in setting stop-loss and take-profit levels strategically.
Price Target Forecasting with the Price Ladder:
The target price labels calculated at important RSI levels provide insights into potential price objectives, aiding in risk management and profit planning.
Flexible Configuration:
Traders can customize key parameters such as the RSI period, lengths for EMA and WMA, target RSI levels, divergence conditions, and support/resistance settings. This flexibility allows the indicator to adapt to different trading styles and strategies.
How to read data
Some use-cases
Used to estimate price according to the RSI level.
When you trade using RSI, you want to set your stop-loss or take-profit levels based on RSI. By looking at the price ladder, you know the corresponding price level to enter a trade.
Used to determine the entry zone.
RSI often reacts to its own previously established support/resistance levels. Use the Auto SnR feature to identify those zones.
Used to determine the trend.
RSI and its moving averages help identify the price trend:
Uptrend: 3 lines separate and point upward.
Downtrend: 3 lines separate and point downward.
Use WMA45 to determine the trend:
Uptrend: WMA45 is moving upward or trading above the 50 level.
Downtrend: WMA45 is moving downward or trading below the 50 level.
Sideways: WMA45 is trading around the 50 level.
Use EMA9 to confirm the trend: A crossover of EMA9 through WMA45 confirms the formation of a new trend.
Configuration
The script allows users to configure a number of important parameters to suit their analytical preferences:
RSI Settings:
RSI Length (rsiLengthInput): The number of periods used to compute the RSI (default is 14, adjustable as needed).
RSI Source (rsiSourceInput): Select the price source (default is the closing price).
RSI Color (rsiClr): The color used to display the RSI line.
Moving Averages on RSI:
EMA Length (emaLength): The period for calculating the EMA on RSI (default is 9).
WMA Length (wmaLength): The period for calculating the WMA on RSI (default is 45).
EMA Color (emaClr) and WMA Color (wmaClr): Customize the colors of the EMA and WMA lines.
Price Ladder Settings:
Toggle Price Ladder (showPrice): Enable or disable the display of the price ladder.
Target RSI Levels: targetRSI1 through targetRSI7: RSI values at which target prices are calculated (default values range from 20, 30, 40, 50, 60, 70 to 80).
Price Label Color (priceColor): The text color for displaying the target price labels.
Divergence Settings:
Divergence Toggle (calculateDivergence): Option to enable or disable divergence calculation and display.
Divergence Conditions:
d_below: RSI level below which bullish divergence is considered.
d_upper: RSI level above which bearish divergence is considered.
Display Divergence Labels (showDivergenceLabel): Option to display labels on the chart when divergence is detected.
Auto Support & Resistance on RSI:
Toggle Auto S&R (enableAutoSnR): Enable or disable automatic plotting of support and resistance levels.
Lookback Periods for Support/Resistance:
L1_lookback: Lookback period for level 1 (e.g., 34 bars).
L2_lookback: Lookback period for level 2 (e.g., 89 bars).
L3_lookback: Lookback period for level 3 (e.g., 200 bars).
Support and Resistance Colors:
rsiSupportClr: Color for the support line.
rsiResistanceClr: Color for the resistance line.
Alerts:
Divergence Alerts: Alert conditions are set up to notify the trader when bullish or bearish divergence is detected, aiding in timely decision-making.

AsianRange&Midnight 2.2### Midnight Setup: Trading Strategy
#### **Bias Definition (Trend Identification)**
- The Daily (D) bias is defined the previous day and validated on the line chart.
- On the Daily chart, identify the nearest V-shaped formation that has broken close to the current price. This formation determines the Daily bias direction.
#### **H4 Bias Analysis (Trend Confirmation)**
- Switch to an H4 chart to refine the analysis.
- Identify a similar V-shaped formation that has broken in the H4 timeframe.
- If the Daily and H4 biases are aligned, the setup is valid.
#### **Entry Strategy (Position Entries)**
- **Bearish Bias (D and H4 identical):**
- Short entry at the high level of the Midnight range.
- **Bullish Bias (D and H4 identical):**
- Long entry at the low level of the Midnight range.
#### **Bias Divergence (Context Adaptation)**
- If the H4 bias is opposite to the Daily bias, this indicates an H4 retracement of the Daily bias.
- Enter a counter-trend trade with reduced risk.
- No TP target beyond 50% of the extension validating the Daily break. It is also not recommended to enter against this divergence beyond 50%.
#### **Divergence Scenarios (Reactions to Divergences)**
- **Daily Bearish Bias, H4 Bullish Bias:**
- Long entry at the Midnight Low.
- **Daily Bullish Bias, H4 Bearish Bias:**
- Short entry at the Midnight High.
#### **Daily Bias Resumption (Trend Alignment)**
- As soon as the H4 bias resumes the Daily bias direction, follow this trend and adjust the position accordingly.
#### **Instructions for Divergent Bias (Managing Divergence)**
- When holding a position with a divergent bias, it is crucial to manage it carefully.
- Exit counter-trend trades as soon as the H4 bias realigns with the Daily bias.
- Limit the duration of counter-trend trades per session and adjust the H4 bias for the next session if needed.
#### **SL/TP Management (Profit Taking and Protection Optimization)**
- **Take Profit (TP):**
- Entry in M15 with a minimum RR of 3.
- TP at 5H NYE, or RR 5, or 15H NYE.
- **Stop Loss (SL):**
- Minimum 15 pips, placed just above the nearest swing to the entry point to protect capital.
- **Red Announcement Days:**
- Either abstain from trading or set a 40-pip SL to limit volatility impact.
- **At 6H/7H NYE:**
- Manage the trade based on its progress: exit, set to BE (Break Even), or keep the SL in place.
- Any SL adjustment outside these rules can only be made if supported by data or backtests.
#### **Risk Management (Capital Protection)**
- Maximum risk of **1% of capital per trade** (allowing for **10 consecutive losses** without significantly affecting capital).
- In case of a loss, **reduce risk by 50% on the next trade** until the loss is recovered.
#### **Efficiency Conditions (When This Setup Works Best)**
- This setup is particularly effective in **strong trends**, where the market has a clear direction.
- It is **less effective in ranging markets**, where prices move within a narrow range without a clear trend.
Setup Midnight : Stratégie de Trading

Market Push Meter - CoffeeStyleMarket Push Meter - CoffeeKiller Indicator Guide
Welcome traders! This guide will walk you through the Market Push Meter indicator, a sophisticated volume analysis tool developed by CoffeeKiller with the help and assistance of FindBetterTrades that measures and visualizes the ongoing battle between buyers and sellers through volume pressure analysis.
🔔 **Warning: This Is Not a Standard Volume Indicator** 🔔 This indicator analyzes volume pressure in a unique way, combining directional volume with price action to identify market imbalances between buyers and sellers. All credit for the core logic for this indicator goes to FindBetterTrades and his/hers Volume Pressure Histogram (Normalized) (this is my adaptation and style added to that core logic, thus the CoffeeStyle name was added).
Core Concept: Volume Pressure Analysis
The foundation of this indicator lies in measuring the imbalance between buying and selling volume, providing insights into which market participants are exerting more pressure on price movements.
Volume Pressure Columns: Buying vs Selling Force
- Positive Green Columns: Net buying pressure
- Negative Red Columns: Net selling pressure
- Color intensity varies based on pressure strength
- Special coloring for new high/low boundaries
Marker Lines: Dynamic Support/Resistance
- High Marker Line (Magenta): Tracks the highest point reached during buying phases
- Low Marker Line (Cyan): Tracks the lowest point reached during selling phases
- Creates visual boundaries showing pressure extremes
Peak Detection System:
- Triangular markers identify significant local maxima and minima
- Background highlighting shows important pressure peaks
- Helps identify potential reversal points and pressure exhaustion
Reference Lines:
- Overbought Level: Threshold for extreme selling pressure
- Oversold Level: Threshold for extreme buying pressure
- Used to identify potential reversal zones
Core Components
1. Volume Pressure Calculation
- Separation of up-volume and down-volume
- Calculation of net volume pressure
- Smoothing for consistent visualization
- Normalization against total volume for percentage scaling
2. Boundary Tracking System
- Automatic detection of highest values in buying phases
- Automatic detection of lowest values in selling phases
- Step-line visualization of boundaries
- Color-coded for easy identification
3. Peak Detection System
- Identification of local maxima and minima
- Background highlighting of significant peaks
- Triangle markers for peak visualization
- Zero-line cross detection for trend changes
4. Threshold Settings
- Extreme threshold multiplier for identifying significant pressure
- Overbought/oversold levels for potential reversals
- Dynamic color coding based on pressure intensity
- Alert conditions for key pressure levels
Main Features
Volume Analysis Settings
- Customizable volume MA length
- Signal smoothing for clearer readings
- Optional log scale for handling wide range variations
- Adjustable threshold multiplier for sensitivity
Visual Elements
- Color-coded columns showing pressure direction and strength
- Dynamic marker lines for pressure boundaries
- Peak triangles for significant turning points
- Background highlighting for peak identification
- Overbought/oversold reference lines
Signal Generation
- Zero-line crosses for trend change signals
- Boundary breaks for pressure strength
- Peak formation for potential reversals
- Color changes for pressure direction and intensity
- Alert conditions for extreme pressure levels
Customization Options
- Volume analysis parameters
- Marker line visibility and colors
- Peak marker display options
- Log scale toggle for handling various markets
- Overbought/oversold threshold adjustments
Trading Applications
1. Trend Identification
- Volume pressure crossing above zero: buying pressure emerging
- Volume pressure crossing below zero: selling pressure emerging
- Column color: indicates pressure direction
- Column height: indicates pressure strength
- Signal line: confirms overall trend direction
2. Reversal Detection
- Peak triangles after extended trend: potential exhaustion
- Background highlighting: significant reversal points
- Volume pressure approaching marker lines: potential trend change
- Color shifts from bright to muted: decreasing pressure
- Readings beyond overbought/oversold levels: potential reversal zones
3. Pressure Analysis
- Breaking above previous high boundary: accelerating buying pressure
- Breaking below previous low boundary: accelerating selling pressure
- Special coloring (magenta/cyan): boundary breaks indicating strength
- Extreme readings: potential climactic buying/selling
4. Market Structure Assessment
- Consecutive higher peaks: strengthening buying structure
- Consecutive lower troughs: strengthening selling structure
- Peak comparisons: relative strength of pressure phases
- Boundary line steps: market structure levels
Optimization Guide
1. Volume Analysis Settings
- Volume MA Length: Default 25 provides balanced signals
- Lower values (10-15): More responsive, potentially noisier
- Higher values (30-50): Smoother, fewer false signals
- Signal Smoothing Length: Default 8 provides good balance
- Lower values: More responsive to pressure changes
- Higher values: Smoother trend identification
2. Threshold Settings
- Extreme Threshold Multiplier: Default 20.0
- Lower values: More signals, potentially more noise
- Higher values: Fewer signals, but more significant
- Overbought/Oversold Levels: Defaults at 20/-20
- Adjust based on instrument volatility
- Wider settings for more volatile instruments
3. Visual Customization
- Marker Line Colors: Adjust for visibility on your chart
- Peak Marker Color: Default yellow provides good contrast
- Enable/disable background highlights based on preference
- Consider log scale for instruments with wide volume ranges
4. Alert Settings
- Configure alerts for high buying pressure
- Configure alerts for high selling pressure
- Set additional alerts for zero-line crosses
- Consider timeframe when setting alert sensitivity
Best Practices
1. Signal Confirmation
- Wait for zero-line crosses to confirm pressure changes
- Look for peak formations to identify potential reversals
- Check for boundary breaks to confirm strong pressure
- Use with price action for entry/exit precision
- Consider extreme threshold crossings as significant signals
2. Timeframe Selection
- Lower timeframes: more signals, potential noise
- Higher timeframes: cleaner signals, less frequent
- Multiple timeframes: confirm signals across time horizons
- Match to your trading style and holding period
3. Market Context
- Strong buying phase: positive columns breaking above marker line
- Strong selling phase: negative columns breaking below marker line
- Columns approaching zero: potential pressure shift
- Columns beyond overbought/oversold: extreme conditions, potential reversal
4. Combining with Other Indicators
- Use with trend indicators for confirmation
- Pair with price action oscillators for divergence detection
- Combine with traditional volume indicators for validation
- Consider support/resistance levels with boundary lines
Advanced Trading Strategies
1. Boundary Break Strategy
- Enter long when volume pressure breaks above previous high marker line
- Enter short when volume pressure breaks below previous low marker line
- Use zero-line as initial stop-loss reference
- Take profits at formation of opposing peaks
2. Peak Trading Strategy
- Identify significant peaks with triangular markers
- Look for consecutive lower peaks in buying phases for shorting opportunities
- Look for consecutive higher troughs in selling phases for buying opportunities
- Use zero-line crosses as confirmation
3. Extreme Reading Strategy
- Look for volume pressure beyond overbought/oversold levels
- Watch for color changes and peak formations
- Enter counter-trend positions after confirmed peaks
- Use tight stops due to extreme market conditions
4. Volume Color Strategy
- Enter long when columns turn bright green (increasing buying pressure)
- Enter short when columns turn bright red (increasing selling pressure)
- Exit when color intensity fades (decreasing pressure)
- Use marker lines as dynamic support/resistance
Practical Analysis Examples
Bullish Market Scenario
- Volume pressure crosses above zero line
- Green columns grow in height and intensity
- High marker line forms steps upward
- Peak triangles appear at local maxima
- Background highlights appear at significant buying pressure peaks
Bearish Market Scenario
- Volume pressure crosses below zero line
- Red columns grow in depth and intensity
- Low marker line forms steps downward
- Peak triangles appear at local minima
- Background highlights appear at significant selling pressure troughs
Consolidation Scenario
- Volume pressure oscillates around zero line
- Column colors alternate frequently
- Marker lines remain relatively flat
- Few or no new peak highlights appear
- Pressure values remain small
Understanding Market Dynamics Through Market Push Meter
At its core, this indicator provides a unique lens to visualize market pressure through volume analysis:
1. Volume Imbalance: By separating and comparing buying volume (up candles) from selling volume (down candles), the indicator provides insights into which side is exerting more pressure in the market.
2. Normalized Pressure: The indicator normalizes volume pressure as a percentage of total volume, making it more comparable across different market conditions and instruments.
3. Dynamic Boundaries: The marker lines create a visual representation of the "high water marks" of pressure in both directions, helping to identify when markets are making new pressure extremes.
4. Exhaustion Signals: The peak detection system highlights moments where pressure has reached a local maximum or minimum, often precursors to reversals or consolidations.
Remember:
- Combine signals from volume pressure, marker lines, and peak formations
- Use appropriate timeframe settings for your trading style
- Customize the indicator to match your visual preferences and market
- Consider overall market conditions and correlate with price action
This indicator works best when:
- Used as part of a comprehensive trading system
- Combined with proper risk management
- Applied with an understanding of current market conditions
- Signals are confirmed by price action and other indicators
DISCLAIMER: This indicator and its signals are intended solely for educational and informational purposes. They do not constitute financial advice. Trading involves significant risk of loss. Always conduct your own analysis and consult with financial professionals before making trading decisions.

RSI + MFI Momentum Mapper - CoffeeKillerRSI + MFI Momentum Mapper - CoffeeKiller Indicator Guide
Welcome traders! This guide will walk you through the RSI + MFI Momentum Mapper indicator, an innovative market analysis tool developed by CoffeeKiller that combines two powerful oscillators to create a comprehensive momentum visualization system.
🔔 **Warning: This Is Not a Standard RSI or MFI Indicator** 🔔 This indicator combines and normalizes RSI and MFI data to create a unified momentum representation with boundary detection and peak signaling features.
Core Concept: Combined Momentum Analysis
The foundation of this indicator lies in merging the strengths of two complementary oscillators - Relative Strength Index (RSI) and Money Flow Index (MFI) - to provide a more robust momentum signal that accounts for both price action and volume.
Directional Columns: Momentum Strength
- Positive Green Columns: Bullish momentum
- Negative Red Columns: Bearish momentum
- Color intensity varies based on momentum strength
- Special coloring for new high/low boundaries
Marker Lines: Dynamic Support/Resistance
- High Marker Line (Magenta): Tracks the highest point reached during a bullish phase
- Low Marker Line (Cyan): Tracks the lowest point reached during a bearish phase
- Creates visual boundaries showing momentum extremes
Peak Detection System:
- Triangular markers identify significant local maxima and minima
- Background highlighting shows important momentum peaks
- Helps identify potential reversal points and momentum exhaustion
Reference Lines:
- Zero Line (Gray): Divides bullish from bearish momentum
- High Line (+1): Upper threshold for extremely bullish conditions
- Low Line (-1): Lower threshold for extremely bearish conditions
Core Components
1. Oscillator Normalization
- RSI and MFI values centered around zero
- Values scaled to create consistent visualization
- Normalized range typically between -1 and +1
- Combination of indicators for signal reliability
2. Boundary Tracking System
- Automatic detection of highest values in bullish phases
- Automatic detection of lowest values in bearish phases
- Step-line visualization of boundaries
- Color-coded for easy identification
3. Peak Detection System
- Identification of local maxima and minima
- Background highlighting of significant peaks
- Triangle markers for peak visualization
- Zero-line cross detection for trend changes
4. Signal Smoothing
- Signal line calculation via SMA
- Helps filter noise and identify trends
- Provides confirmation of momentum direction
Main Features
Oscillator Settings
- Customizable RSI length for sensitivity control
- Customizable MFI length for sensitivity control
- Normalized display for consistent visualization
- Signal smoothing for clearer readings
Visual Elements
- Color-coded columns showing momentum direction and strength
- Dynamic marker lines for momentum boundaries
- Peak triangles for significant turning points
- Background highlighting for peak identification
- Reference lines for momentum threshold levels
Signal Generation
- Zero-line crosses for trend change signals
- Boundary breaks for momentum strength
- Peak formation for potential reversals
- Color changes for momentum direction and acceleration
Customization Options
- RSI and MFI length parameters
- Marker line visibility and colors
- Peak marker color selection
- Peak background display options
Trading Applications
1. Trend Identification
- Directional line crossing above zero: bullish trend beginning
- Directional line crossing below zero: bearish trend beginning
- Column color: indicates momentum direction
- Column height: indicates momentum strength
2. Reversal Detection
- Peak triangles after extended trend: potential exhaustion
- Background highlighting: significant reversal points
- Directional line approaching marker lines: potential trend change
- Color shifts from bright to muted: decreasing momentum
3. Momentum Analysis
- Breaking above previous high boundary: accelerating bullish momentum
- Breaking below previous low boundary: accelerating bearish momentum
- Special coloring (magenta/cyan): boundary breaks indicating strength
- Approaching +1/-1 lines: extreme momentum conditions
4. Market Structure Assessment
- Consecutive higher peaks: strengthening bullish structure
- Consecutive lower troughs: strengthening bearish structure
- Peak comparisons: relative strength of momentum phases
- Boundary line steps: market structure levels
Optimization Guide
1. Oscillator Settings
- RSI Length: Default 14 provides balanced signals
- Lower values (7-10): More responsive, potentially noisier
- Higher values (20-30): Smoother, fewer false signals
- MFI Length: Default 14 provides balanced signals
- Lower values: More responsive to volume changes
- Higher values: Less sensitive to short-term volume spikes
2. Visual Customization
- Marker Line Colors: Adjust for visibility on your chart
- Peak Marker Color: Default yellow provides good contrast
- Enable/disable background highlights based on preference
- Consider chart background when selecting colors
3. Signal Interpretation
- Stronger signals: When directional line approaches +1/-1
- Confirmation: When peaks form after extended momentum
- Early warnings: When color intensity changes before direction
- Trend strength: Distance between zero line and current reading
4. Reference Line Usage
- Zero line: Primary trend divider
- +1/-1 lines: Extreme momentum thresholds
- Marker lines: Dynamic support/resistance levels
- Distance from reference: Momentum strength measure
Best Practices
1. Signal Confirmation
- Wait for zero-line crosses to confirm trend changes
- Look for peak formations to identify potential reversals
- Check for boundary breaks to confirm strong momentum
- Use with price action for entry/exit precision
2. Timeframe Selection
- Lower timeframes: more signals, potential noise
- Higher timeframes: cleaner signals, less frequent
- Multiple timeframes: confirm signals across time horizons
- Match to your trading style and holding period
3. Market Context
- Strong bullish phase: positive columns breaking above marker line
- Strong bearish phase: negative columns breaking below marker line
- Columns approaching zero: potential trend change
- Columns approaching +1/-1: extreme conditions, potential reversal
4. Combining with Other Indicators
- Use with trend indicators for confirmation
- Pair with other oscillators for divergence detection
- Combine with volume analysis for validation
- Consider support/resistance levels with boundary lines
Advanced Trading Strategies
1. Boundary Break Strategy
- Enter long when directional line breaks above previous high marker line
- Enter short when directional line breaks below previous low marker line
- Use zero-line as initial stop-loss reference
- Take profits at formation of opposing peaks
2. Peak Trading Strategy
- Identify significant peaks with triangular markers
- Look for consecutive lower peaks in bullish phases for shorting opportunities
- Look for consecutive higher troughs in bearish phases for buying opportunities
- Use zero-line crosses as confirmation
3. Extreme Reading Strategy
- Look for directional line approaching +1/-1 lines
- Watch for color changes and peak formations
- Enter counter-trend positions after confirmed peaks
- Use tight stops due to extreme momentum conditions
4. Column Color Strategy
- Enter long when columns turn bright green (increasing momentum)
- Enter short when columns turn bright red (increasing momentum)
- Exit when color intensity fades (decreasing momentum)
- Use marker lines as dynamic support/resistance
Practical Analysis Examples
Bullish Market Scenario
- Directional line crosses above zero line
- Green columns grow in height and intensity
- High marker line forms steps upward
- Peak triangles appear at local maxima
- Background highlights appear at significant momentum peaks
Bearish Market Scenario
- Directional line crosses below zero line
- Red columns grow in depth and intensity
- Low marker line forms steps downward
- Peak triangles appear at local minima
- Background highlights appear at significant momentum troughs
Consolidation Scenario
- Directional line oscillates around zero line
- Column colors alternate frequently
- Marker lines remain relatively flat
- Few or no new peak highlights appear
- Directional values remain small
Understanding Market Dynamics Through RSI + MFI Momentum Mapper
At its core, this indicator provides a unique lens to visualize market momentum by combining two complementary oscillators:
1. Combined Strength: By averaging RSI (price-based) and MFI (volume-based), the indicator provides a more comprehensive view of market momentum that considers both price action and buying/selling pressure.
2. Normalized Scale: The indicator normalizes values around zero, making it easier to identify bullish vs bearish conditions and the relative strength of momentum in either direction.
3. Dynamic Boundaries: The marker lines create a visual representation of the "high water marks" of momentum in both directions, helping to identify when markets are making new momentum extremes.
4. Exhaustion Signals: The peak detection system highlights moments where momentum has reached a local maximum or minimum, often precursors to reversals or consolidations.
Remember:
- Combine signals from directional line, marker lines, and peak formations
- Use appropriate timeframe settings for your trading style
- Customize the indicator to match your visual preferences
- Consider market conditions and correlate with price action
This indicator works best when:
- Used as part of a comprehensive trading system
- Combined with proper risk management
- Applied with an understanding of current market conditions
- Signals are confirmed by price action and other indicators
DISCLAIMER: This indicator and its signals are intended solely for educational and informational purposes. They do not constitute financial advice. Trading involves significant risk of loss. Always conduct your own analysis and consult with financial professionals before making trading decisions.

Alpha Wave System @DaviddTechAlpha Wave DaviddTech System by DaviddTech is an advanced, meticulously engineered trading indicator adhering strictly to the DaviddTech methodology. Rather than simply combining popular indicators, Alpha Wave strategically integrates specially-selected technical components—each optimized to enhance their combined strengths while neutralizing individual weaknesses, providing traders with clear, consistent, and high-probability trading signals.
Valid Setup:
🎯 Why This Combination Matters:
Quantum Adaptive Moving Average (Baseline):
This advanced adaptive MA provides superior responsiveness to market shifts by dynamically adjusting its sensitivity, clearly indicating the primary market direction and reducing lag compared to standard moving averages.
WavePulse Indicator (CoralChannel-based Confirmation #1):
Precisely detects shifts in momentum and price acceleration, allowing traders to anticipate trend continuation or reversals effectively, significantly enhancing trade accuracy.
Quantum Channel (G-Channel-based Confirmation #2):
Dynamically captures price volatility ranges, offering reliable trend structure validation and clear support/resistance channels, further increasing signal reliability.
Momentum Density (Volatility Filter):
Ensures traders enter only during optimal volatility conditions by quantifying momentum intensity, effectively filtering out low-quality, low-momentum scenarios.
Dynamic ATR-based Trailing Stop (Exit System):
Automatically manages trade exits with optimized ATR-based stop levels, systematically securing profits while effectively managing risk.
These meticulously integrated components reinforce each other's strengths, providing traders with a robust, disciplined, and clearly structured approach aligned with the DaviddTech methodology.
🔥 Latest Update – Enhanced BUY & SELL Signals:
Alpha Wave now clearly displays automated BUY and SELL signals directly on your chart, coupled with a comprehensive dashboard table for immediate signal validation. Signals appear only when all components—including baseline, confirmations, and volatility—are in alignment, significantly improving trade accuracy and confidence.
📌 How Traders Benefit from the New Signals:
BUY Signal: Execute long trades when Quantum Adaptive MA signals bullish, confirmed by bullish WavePulse momentum, bullish Quantum Channel structure, and strong Momentum Density readings.
SELL Signal: Clearly marked for entering short positions under bearish market conditions verified through Quantum Adaptive MA, WavePulse bearish momentum, Quantum Channel confirmation, and sufficient Momentum Density.
Signal Validation: A dedicated dashboard provides immediate visual strength metrics, allowing traders to quickly validate signals before execution, significantly enhancing trading discipline and consistency.
📊 Recommended DaviddTech Trading Plan:
Baseline: Determine overall market direction using Quantum Adaptive MA. Only trade in the indicated baseline direction.
Confirmations: Validate potential entries with WavePulse and Quantum Channel alignment.
Volatility Filter: Confirm sufficient market volatility with Momentum Density before entry.
Trailing Stop Loss: Manage risk and secure profits using the dynamic ATR-based trailing stop system.
Entries & Exits: Only execute trades when signals and dashboard components unanimously align.
🖼️ Visual Examples:
Alpha Wave by DaviddTech clearly demonstrates how an intelligently integrated system provides significantly superior trading insights compared to standalone indicators, ensuring precise, disciplined, and profitable market entries and exits across all trading environments.

Support & Resistance + EMA + Swing SL (3 Min)### **📌 Brief Description of the Script**
This **Pine Script indicator** for TradingView displays **Support & Resistance levels, EMAs (21 & 26), and Swing High/Low-based Stop-Loss (SL) points** on a **3-minute timeframe**.
---
### **🔹 Key Features & Functionality**
1️⃣ **🟥 Support & Resistance Calculation:**
- Finds the **highest & lowest price over the last 50 candles**
- Plots **Resistance (Red) & Support (Green) levels**
2️⃣ **📈 EMA (Exponential Moving Averages):**
- **21 EMA (Blue)** and **26 EMA (Orange)** for trend direction
- Helps in identifying bullish or bearish momentum
3️⃣ **📊 Swing High & Swing Low Detection:**
- Identifies **Swing Highs (Higher than last 5 candles) as SL for Short trades**
- Identifies **Swing Lows (Lower than last 5 candles) as SL for Long trades**
- Plots these levels as **Purple (Swing High SL) & Yellow (Swing Low SL) dotted lines**
4️⃣ **📌 Labels on Swing Points:**
- **"HH SL"** is placed on Swing Highs
- **"LL SL"** is placed on Swing Lows
5️⃣ **⚡ Breakout Detection:**
- Detects if **price crosses above Resistance** (Bullish Breakout)
- Detects if **price crosses below Support** (Bearish Breakout)
- Background color changes to **Green (Bullish)** or **Red (Bearish)**
6️⃣ **🚨 Alerts for Breakouts:**
- Sends alerts when **price breaks above Resistance or below Support**
---
### **🎯 How to Use This Indicator?**
- **Trade with Trend:** Follow **EMA crossovers** and Support/Resistance levels
- **Set Stop-Loss:** Use **Swing High as SL for Shorts** & **Swing Low as SL for Longs**
- **Look for Breakouts:** Enter trades when price **crosses Resistance or Support**
This script is **ideal for scalping & intraday trading** in a **3-minute timeframe** 🚀🔥
Let me know if you need **any modifications or improvements!** 📊💹

Pivot Point Calculator PPC V2 by [KhedrFx]📈 Trade Smarter with the Pivot Point Calculator (PPC) by KhedrFx
Want to spot key price levels and make better trading decisions? The Pivot Point Calculator (PPC) by KhedrFx is your go-to TradingView tool for identifying potential support and resistance zones. Whether you’re a Scalper trader, day trader, swing trader, or long-term investor, this script helps you plan precise entries and exits with confidence.
🔹 How to Use Pivot Points in Trading
📊 Step 1: Identify Key Levels
The PPC automatically plots:
Pivot Point (P): The main level where sentiment shifts between bullish and bearish.
Support Levels (S1, S2, S3): Areas where price may bounce higher.
Resistance Levels (R1, R2, R3): Areas where price may face selling pressure.
These levels act as dynamic price zones, helping you anticipate potential market movements.
🔥 Step 2: Choose Your Trading Strategy
1️⃣ Breakout Trading
Buy when the price breaks above the pivot point (P) with strong momentum.
Sell when the price drops below the pivot point (P) with strong momentum.
Use R1, R2, or R3 as profit targets in an uptrend and S1, S2, or S3 in a downtrend.
2️⃣ Reversal (Bounce) Trading
Buy when the price pulls back to S1, S2, or S3 and shows bullish confirmation (e.g., candlestick patterns like a bullish engulfing or hammer).
Sell when the price rallies to R1, R2, or R3 and shows bearish confirmation (e.g., rejection wicks or a bearish engulfing pattern).
🎯 Step 3: Set Smart Stop-Loss & Take-Profit Levels
Stop-Loss: Place it slightly below support (for buy trades) or above resistance (for sell trades).
Take-Profit: Use the next pivot level as a target.
Extreme Zones: R3 and S3 often signal strong reversals or breakouts—watch them closely!
🚀 How to Get Started
1️⃣ Add the PPC script to your TradingView chart.
2️⃣ Choose a timeframe that fits your strategy (5m, 15m, 30m, 1H, 4H, Daily, or Weekly).
3️⃣ Use the pivot points and support/resistance levels to fine-tune your trade entries, exits, and risk management.
⚠️ Trade Responsibly
This tool helps you analyze the market, but it’s not a guarantee of profits. Always do your own research, manage risk, and trade with caution.
💡 Ready to take your trading to the next level? Try the Pivot Point Calculator (PPC) by KhedrFx and start trading with confidence today! 🚀

Trading Sessions Highs/Lows | InvrsROBINHOODTrading Sessions Highs/Lows | InvrsROBINHOOD
🚀 A powerful indicator for tracking key trading sessions and the highs and lows of each session!
📌 Description
The Trading Sessions Highs/Lows indicator visually marks the most critical trading sessions—Asia, London, and New York—using small colored dots at the bottom of the candle. It also tracks and plots the highs and lows of each session, along with the Daily Open and Weekly Open levels.
This tool is designed to help traders identify session-based liquidity zones, price reactions, and potential trade setups with minimal chart clutter.
Key Features:
✅ Session markers (Asia, London, NY AM, NY Lunch, NY PM) plotted as small dots
✅ Plots session highs and lows for market structure insights
✅ Daily Open line for intraday reference
✅ Weekly Open line for higher timeframe bias
✅ Alerts for session high/low breaks to capture momentum shifts
✅ User-defined UTC offset for global traders
✅ Customizable session colors for personal preference
📖 How to Use the Indicator
1️⃣ Understanding the Sessions
Asia Session (Yellow Dot) → Marks liquidity buildup & pre-London moves
London Session (Blue Dot) → Strong volatility, breakout opportunities
New York AM Session (Green Dot) → Major trends & institutional participation
New York Lunch (Red Dot) → Low volume, ranging market
New York PM Session (Dark Green Dot) → End-of-day movements & reversals
2️⃣ Session Highs & Lows for Market Structure
Session Highs can act as resistance or breakout points.
Session Lows can act as support or stop-hunt zones.
Break of a session high/low with volume may indicate continuation or reversal.
3️⃣ Using the Daily & Weekly Open
The Daily Open (Black Line) helps gauge the intraday trend.
Above Daily Open → Bearish Bias
Below Daily Open → Bullish Bias
The Weekly Open (Red Line) sets the higher timeframe directional bias.
4️⃣ Alerts for Breakouts
The indicator will trigger alerts when price breaks session highs or lows.
Useful for setting stop-losses, breakout trades, and risk management.
💡 Why This Indicator is Important for Beginners
1️⃣ Avoids Overtrading:
Many beginners trade in low-volume periods (NY Lunch, Asia session) and get stuck in choppy price action.
This indicator highlights when volatility is high so traders focus on better opportunities.
2️⃣ Session-Based Liquidity Traps:
Market makers often run stops at session highs/lows before reversing.
Watching session breaks prevents traders from falling into liquidity grabs.
3️⃣ Reduces Emotional Trading:
If price is above the Daily Open, a beginner shouldn’t look for shorts.
If price is below a key session low, it may signal a fake breakout.
4️⃣ Aligns with Institutional Trading:
Smart money traders use session highs/lows to set stop hunts & reversals.
Beginners can use this indicator to spot these zones before entering trades.
🛡️ How to Mitigate Risk with This Indicator
✅ Wait for Confirmations – Don’t trade blindly at session highs/lows. Look for wicks, rejections, or break/retests.
✅ Use Stop-Loss Above/Below Session Levels – If you’re going long, set SL below a session low. If short, set SL above a session high.
✅ Watch Volume & News Events – Breakouts without strong volume or news may be fake moves.
✅ Combine with Other Strategies – Use price action, trendlines, or EMAs with this indicator for higher probability trades.
✅ Use the Weekly Open for Trend Bias – If price stays below the Weekly Open, avoid bullish setups unless key support holds.
🎯 Who is This Indicator For?
📌 Beginners who need clear session-based trading levels.
📌 Day traders & scalpers looking to refine their intraday setups.
📌 Smart money traders using liquidity concepts.
📌 Swing traders tracking higher timeframe momentum shifts.
🚀 Final Thoughts
This indicator is an essential tool for traders who want to understand market structure, liquidity, and volatility cycles. Whether you’re trading forex, stocks, or crypto, it helps you stay on the right side of the market and avoid unnecessary risks.
🔹 Set it up, customize your colors, define your UTC offset, and start trading smarter today! 🏆📈

EMA Crossover Backtest [BarScripts]This indicator lets you backtest an EMA crossover strategy with built-in risk management and trade tracking. It simulates long and short trades based on EMA crossovers, allowing you to fine-tune entry conditions, stop-loss placement, and reward/risk settings.
🔹 How It Works:
Long Entry: Fast EMA crosses above Slow EMA, and price closes above Fast EMA.
Short Entry: Fast EMA crosses below Slow EMA, and price closes below Fast EMA.
Stop Loss: Set based on previous bars or a fixed amount.
Take Profit: Adjustable reward/risk ratio.
Higher Timeframe Confluence: Confirms trades based on a larger timeframe.
Trade Hours Filter: Limits trades to specific time windows.
🔹 Key Features:
✅ Shows Entry & Exit Points with visual trade lines.
✅ Customizable EMA Lengths to fit any strategy.
✅ P&L Tracking & Statistics to measure performance.
✅ Position Sizing Options: Fixed position, fixed risk, or percentage of balance.
✅ Commissions Tracking (based on total trades, not contracts).
Use this tool to fine-tune your EMA crossover strategy and see how it performs over time! 🚀
💬 Let me know your feedback—suggest improvements, report issues, or request new features!

Discount/Premium OTE LevelsThis indicator is created to identify discount/premium areas to provide additional confluence to trades taken. The underlying theory is that the trades taken in discounted areas are likely to have less risk due to a smaller stop loss and a higher reward/risk ratio.
The indicator operates by first identifying a zone between the last major swing high and low. These highs and lows are determined as price points that at the extremes within the number of bars to the left, as defined by the "Swing Sensitivity" setting.
Once a price zone is established, the indicator verifies that the zone meets the minimum size in points as configured via the "Minimum size" setting to be considered tradable. Zones that are too small may not provide a sufficient range even for scalping. The default value is 42 points based on Nasdaq, which means that the distance between inner most OTE levels (0.382 and 0.618) is at least 10 points.
When a valid zone is identified, it is then subdivided into areas of interest based on OTE levels, which can be configured/adjusted via the "Levels to Draw" setting. These levels represent the midpoint (50%), which distinguishes between premium and discount, and the three OTE levels 0.79, 0.705, 0.618, above the 50% for discount and below the 50% for premium.
For example, if a zone is formed initially by a swing low followed by a swing high with the assumption that the draw is higher, the indicator can be used to formulate long positions from below the 50% level starting at 0.38 OTE level, or ideally at 0.295 OTE level using 0 as a stop loss. Alternatively, if the 50% level is not yet tapped, short scalp positions can be made from 0.79-0.618 OTE levels with 50% as a partial or TP target.
See for long/short example
Typically, the indicator will show only a single zone. However, there may be cases with two zones: one larger parent zone containing a smaller, valid price zone within itself.
The indicator will automatically invalidate and remove the zone once the high/low of the zone is invalidated.
Configuration:
The indicator provides several visualization options for customization, including:
Color settings for OTE levels, with separate settings for edge/50% color, premium, and discount levels.
Settings for line style for OTE levels.
Settings to determine whether to show prices on level labels.
Settings to decide if lines should be extended to the right.

High-Probability IndicatorExplanation of the Code
Trend Filter (EMA):
A 50-period Exponential Moving Average (EMA) is used to determine the overall trend.
trendUp is true when the price is above the EMA.
trendDown is true when the price is below the EMA.
Momentum Filter (RSI):
A 14-period RSI is used to identify overbought and oversold conditions.
oversold is true when RSI ≤ 30.
overbought is true when RSI ≥ 70.
Volatility Filter (ATR):
A 14-period Average True Range (ATR) is used to measure volatility.
ATR is multiplied by a user-defined multiplier (default: 2.0) to set a volatility threshold.
Ensures trades are only taken during periods of sufficient volatility.
Entry Conditions:
Long Entry: Price is above the EMA (uptrend), RSI is oversold, and the candle range exceeds the ATR threshold.
Short Entry: Price is below the EMA (downtrend), RSI is overbought, and the candle range exceeds the ATR threshold.
Exit Conditions:
Take Profit: A fixed percentage above/below the entry price.
Stop Loss: A fixed percentage below/above the entry price.
Visualization:
The EMA is plotted on the chart.
Background colors highlight uptrends and downtrends.
Buy and sell signals are displayed as labels on the chart.
Alerts:
Alerts are triggered for buy and sell signals.
How to Use the Indicator
Trend Filter:
Only take trades in the direction of the trend (e.g., long in an uptrend, short in a downtrend).
Momentum Filter:
Look for oversold conditions in an uptrend for long entries.
Look for overbought conditions in a downtrend for short entries.
Volatility Filter:
Ensure the candle range exceeds the ATR threshold to avoid low-volatility trades.
Risk Management:
Use the built-in take profit and stop loss levels to manage risk.
Optimization Tips
Backtesting:
Test the indicator on multiple timeframes and assets to evaluate its performance.
Adjust the input parameters (e.g., EMA length, RSI length, ATR multiplier) to optimize for specific markets.
Combination with Other Strategies:
Add additional filters, such as volume analysis or support/resistance levels, to improve accuracy.
Risk Management:
Use proper position sizing and risk-reward ratios to maximize profitability.
Disclaimer
No indicator can guarantee an 85% win ratio due to the inherent unpredictability of financial markets. This script is provided for educational purposes only. Always conduct thorough backtesting and paper trading before using any strategy in live trading.
Let me know if you need further assistance or enhancements!

Daily COC Strategy with SHERLOCK WAVESThis indicator implements a unique trading strategy known as the "Daily COC (Candle Over Candle) Strategy" enhanced with "SHERLOCK WAVES" for pattern recognition. It's designed for traders looking to capitalize on specific candlestick formations with a negative risk-reward ratio, with the aim of achieving a high win rate (over 70%) through numerous trading opportunities, despite each trade having a higher risk relative to the reward.
Key Features:
Pattern Recognition: Identifies a setup based on three consecutive candles - a red candle followed by a shooting star, then an entry candle that does not break below the shooting star's low.
Negative Risk/Reward Trade Selection: Focuses on entries where the potential stop loss is greater than the take profit, banking on a high win rate to offset the individual trade's negative risk-reward ratio.
Visual Signals:
Green Label: Marks potential entry points at the high of the candle before the entry.
Green Dot: Indicates a winning trade closure.
Red Dot: Signals a losing trade closure.
Blue Circle: Warns when the current candle is within 2% of breaking above the previous candle's high, suggesting a potential setup is developing.
Green Circle: Plots the take profit level.
Red Circle: Plots the stop loss level.
Dynamic Statistics: A live updating label showing the number of trades, wins, losses, open trades, current account balance, and win percentage.
Customizable Parameters:
Risk % per Trade: Adjust the percentage of your account balance you're willing to risk on each trade.
Initial Account Balance: Set your starting balance for tracking performance.
Start Date for Strategy: Define when the strategy should start calculating from, allowing for backtesting.
Alerts:
An alert condition is set for when a potential trade setup is developing, helping traders prepare for entries.
Usage Tips:
This strategy is predicated on the idea that a high win rate can compensate for the negative risk-reward ratio of individual trades. It might not suit all market conditions or traders' risk profiles.
Use this strategy in conjunction with other analysis methods to validate trade setups.
Note: Always backtest thoroughly before applying to live markets. Consider this tool as part of a broader trading strategy, not a standalone solution. Monitor your win rate and adjust your risk management accordingly to ensure the strategy remains profitable over time.
This description now correctly explains the purpose behind the negative risk-reward ratio in the context of your trading strategy.

Channels by SmanovIndicator Description
“Channels by Smanov” is a multi-channel indicator that plots dynamic support and resistance zones around a moving average line. It is composed of two main parts:
FL 1 (Flexible Channels):
A Simple Moving Average (SMA) serves as the Basis.
Upper and lower bands are calculated by adding and subtracting an ATR-based buffer from the Basis.
User-defined inputs (such as Half Length, ATR Period, and ATR Multiplier) allow for flexibility in adapting the channel width to different market conditions.
FL 2 (Fixed Channels):
Eight additional bands expand on the same SMA + ATR logic but use fixed ATR multipliers (ranging from 2.2 up to 5.0).
These extra lines can help you gauge more distant levels of potential support or resistance.
By combining an SMA (to smooth price data) with ATR (to gauge volatility), this indicator highlights areas where price may be “stretched” relative to recent volatility. Traders often use channel-based indicators to identify potential “overbought” or “oversold” conditions, as well as to spot trend continuations or reversals.
How to Use / Trading Strategy
Trend Identification (Basis Line):
The middle line (the SMA) can be used as a trend filter:
If price consistently stays above the basis, it suggests an uptrend.
If price consistently stays below the basis, it suggests a downtrend.
Reversal Opportunities (Outer Bands):
When price moves into or beyond the upper bands, it may signal overbought conditions, creating potential short (or profit-taking) opportunities.
Conversely, when price dips into or beyond the lower bands, it may signal oversold conditions, which some traders use for initiating or adding to long positions.
Breakout or Continuation Signals:
In a strong trend, price may “ride” along the outer channels.
A clear break above/below a channel that previously acted as resistance/support could hint at trend continuation.
Failure to break these levels could suggest a potential reversal or consolidation phase.
Stop-Loss Placement:
Traders often place stops just outside a relevant band. For example, if you go long on a dip near a lower band, you might place your stop slightly below that band, relying on the ATR-based buffer to reflect normal volatility.
Multiple Timeframe Analysis:
Consider confirming signals on a higher timeframe (e.g., 4-hour or daily) while taking entries on a lower timeframe.
Channels on higher timeframes can act as stronger support or resistance, offering additional confluence.
Disclaimer
This indicator is provided for educational purposes and does not guarantee specific results. Trading involves risk, and individual traders are responsible for managing their own risk and capital. Always conduct thorough analysis and use appropriate risk management (e.g., stop-losses) when entering any market positions.
Enjoy using Channels by Smanov! Your feedback and personal insights can further refine the indicator’s settings for your preferred trading style. Good luck and trade responsibly!
This Pine Script™ code is subject to the terms of the Mozilla Public License 2.0.
© Smanov_I

200 EMA Breakout & Retest Strategy200 EMA Breakout & Retest Strategy
This script is designed for traders who rely on the 200 EMA as a key indicator for trend direction and trade setups. The strategy identifies potential buy and sell opportunities based on breakouts and subsequent retests of the 200 EMA.
How It Works
EMA Breakout Detection:
The script monitors when the price crosses and closes above or below the 200 EMA.
No signal is generated immediately upon the breakout.
Retest Confirmation:
After the breakout, the price must retrace to touch the 200 EMA.
A valid signal occurs only when the price touches the EMA and the candle closes above (for buy) or below (for sell).
Trade Signal Generation:
Once the retest is confirmed:
A Buy Signal is generated if the price closes above the 200 EMA after the retest.
A Sell Signal is generated if the price closes below the 200 EMA after the retest.
The script calculates:
Stop Loss: Placed at the low of the candle for a buy signal and at the high of the candle for a sell signal.
Take Profit: Based on a customizable Risk-Reward Ratio (default is 1:2).
Visual Indicators:
The 200 EMA is plotted on the chart for reference.
Buy/Sell signals are displayed as labels on the chart.
Stop loss and take profit levels are drawn using dotted lines.
Customization Options
EMA Length: Adjustable (default is 200).
Risk-Reward Ratio: Customizable to suit different trading styles.
Who Is This For?
This strategy is ideal for traders who:
Prefer trading with the trend using EMA-based strategies.
Look for precise entry points with confirmation from retests.
Require automated calculation of risk-reward levels.

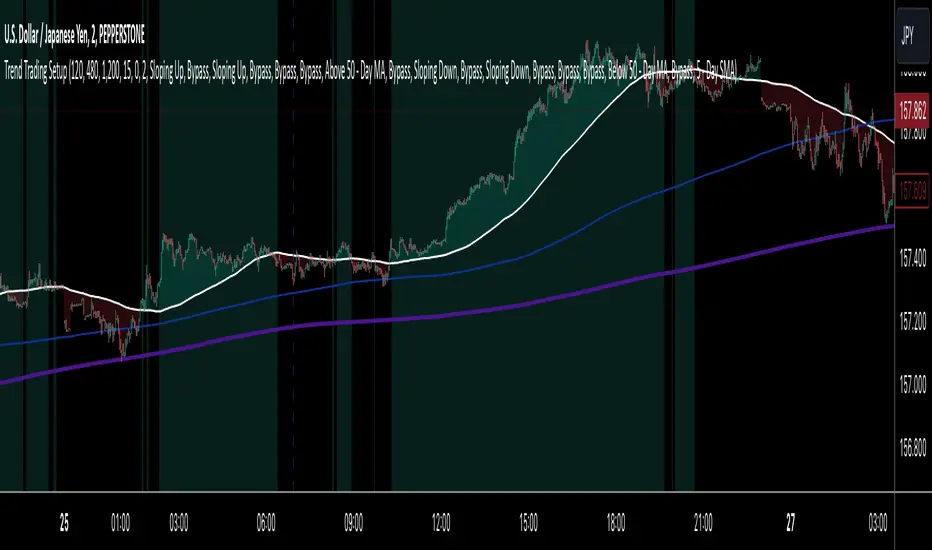
Trend Trading SetupTrend Trading Setup is an indicator that is designed to assist with trend trading by indicating when the basic conditions for a trade in either direction are met.
Note: Default values assume the 1-hour chart
The idea is that this will allow a trader to know for the first glance if a market is worthy of closer inspection or not.
Indicator Features:
1. Simple Moving Averages - defining the basic trade conditions
5 - Day Moving Average
20 - Day Moving Average
50 - Day Moving Average
2. Visualisation of The Price Location In Relation To The 5 - Day Moving Average
If price is above the 5-day Moving Average, the space between them is green. If price is below the 5-day Moving Average, the space between them is red.
3. Risk Management Section - calculates an ATR-based stop loss.
4. Indication When The Conditions Are Met
If the conditions for a bullish bias are met, the chart background is green. If the conditions for a bearish bias are met, the chart background is red. If none of the conditions are met, the chart background is left as is.
A user can adjust the length of any of the Moving Averages as well as the length of the ATR and the ATR Multiplier for the stop loss size. Default values assume the 1-hour chart, but surprisingly the settings seem to show logical results also on other time frames.
The Setup:
Bullish - 5-day Moving Average is above the 50-day Moving Average. The slope of both of the Moving Averages is positive and the price has to be above the 5-day Moving Average.
Bearish - Exactly the same as for the bullish bias, but opposite.
I do not recommend to take this Trend Trading Setup indicator as the only reason for a position. However, I believe it can be very useful to show when the overall conditions are in favour of a long position or in favour of a short position.
$TUBR: 7-25-99 Moving Average7, 25, and 99 Period Moving Averages
This indicator plots three moving averages: the 7-period, 25-period, and 99-period Simple Moving Averages (SMA). These moving averages are widely used to smooth out price action and help traders identify trends over different time frames. Let's break down the significance of these specific moving averages from both supply and demand perspectives and a price action perspective.
1. Supply and Demand Perspective:
- 7-period Moving Average (Short-Term) :
The 7-period moving average represents the short-term sentiment in the market. It captures the rapid fluctuations in price and is heavily influenced by recent supply and demand changes. Traders often look to the 7-period SMA for immediate price momentum, with price moving above or below this line signaling short-term strength or weakness.
- Bullish Supply/Demand : When price is above the 7-period SMA, it suggests that buyers are currently in control and demand is higher than supply. Conversely, price falling below this line indicates that supply is overpowering demand, leading to a short-term downtrend.
Is current price > average price in past 7 candles (depending on timeframe)? This will tell you how aggressive buyers are in short term.
- Key Supply/Demand Zones : The 7-period SMA often acts as dynamic support or resistance in a trending market, where traders might use it to enter or exit positions based on how price interacts with this level.
- 25-period Moving Average (Medium-Term) :
The 25-period SMA smooths out more of the noise compared to the 7-period, providing a more stable indication of intermediate trends. This moving average is often used to gauge the market's supply and demand balance over a broader timeframe than the short-term 7-period SMA.
- Supply/Demand Balance : The 25-period SMA reflects the medium-term equilibrium between supply and demand. A crossover between the price and the 25-period SMA may indicate a shift in this balance. When price sustains above the 25-period SMA, it shows that demand is strong enough to maintain an upward trend. Conversely, if the price stays below it, supply is likely exceeding demand.
Is current price > average price in past 25 candles (depending on timeframe)? This will tell you how aggressive buyers are in mid term.
- Momentum Shift : Crossovers between the 7-period and 25-period SMAs can indicate momentum shifts between short-term and medium-term demand. For example, if the 7-period crosses above the 25-period, it often signifies growing short-term demand relative to the medium-term trend, signaling potential buy opportunities. What this crossover means is that if 7MA > 25MA that means in past 7 candles average price is more than past 25 candles.
- 99-period Moving Average (Long-Term):
The 99-period SMA represents the long-term trend and reflects the market's supply and demand over an extended period. This moving average filters out short-term fluctuations and highlights the market's overall trajectory.
- Long-Term Supply/Demand Dynamics : The 99-period SMA is slower to react to changes in supply and demand, providing a more stable view of the market's overall trend. Price staying above this line shows sustained demand dominance, while price consistently staying below reflects ongoing supply pressure.
Is current price > average price in past 99 candles (depending on timeframe)? This will tell you how aggressive buyers are in long term.
- Market Trend Confirmation : When both the 7-period and 25-period SMAs are above the 99-period SMA, it signals a strong bullish trend with demand outweighing supply across all timeframes. If all three SMAs are below the 99-period SMA, it points to a bear market where supply is overpowering demand in both the short and long term.
2. Price Action Perspective :
- 7-period Moving Average (Short-Term Trends):
The 7-period moving average closely tracks price action, making it highly responsive to quick shifts in price. Traders often use it to confirm short-term reversals or continuations in price action. In an uptrend, price typically stays above the 7-period SMA, whereas in a downtrend, price stays below it.
- Short-Term Price Reversals : Crossovers between the price and the 7-period SMA often indicate short-term reversals. When price breaks above the 7-period SMA after staying below it, it suggests a potential bullish reversal. Conversely, a price breakdown below the 7-period SMA could signal a bearish reversal.
- 25-period Moving Average (Medium-Term Trends) :
The 25-period SMA helps identify the medium-term price action trend. It balances short-term volatility and longer-term stability, providing insight into the more persistent trend. Price pullbacks to the 25-period SMA during an uptrend can act as a buying opportunity for trend traders, while pullbacks during a downtrend may offer shorting opportunities.
- Pullback and Continuation: In trending markets, price often retraces to the 25-period SMA before continuing in the direction of the trend. For instance, if the price is in a bullish trend, traders may look for support at the 25-period SMA for potential continuation trades.
- 99-period Moving Average (Long-Term Trend and Market Sentiment ):
The 99-period SMA is the most critical for identifying the overall market trend. Price consistently trading above the 99-period SMA indicates long-term bullish momentum, while price staying below the 99-period SMA suggests bearish sentiment.
- Trend Confirmation : Price action above the 99-period SMA confirms long-term upward momentum, while price action below it confirms a downtrend. The space between the shorter moving averages (7 and 25) and the 99-period SMA gives a sense of the strength or weakness of the trend. Larger gaps between the 7 and 99 SMAs suggest strong bullish momentum, while close proximity indicates consolidation or potential reversals.
- Price Action in Trending Markets : Traders often use the 99-period SMA as a dynamic support/resistance level. In strong trends, price tends to stay on one side of the 99-period SMA for extended periods, with breaks above or below signaling major changes in market sentiment.
Why These Numbers Matter:
7-Period MA : The 7-period moving average is a popular choice among short-term traders who want to capture quick momentum changes. It helps visualize immediate market sentiment and is often used in conjunction with price action to time entries or exits.
- 25-Period MA: The 25-period MA is a key indicator for swing traders. It balances sensitivity and stability, providing a clearer picture of the intermediate trend. It helps traders stay in trades longer by filtering out short-term noise, while still being reactive enough to detect reversals.
- 99-Period MA : The 99-period moving average provides a broad view of the market's direction, filtering out much of the short- and medium-term noise. It is crucial for identifying long-term trends and assessing whether the market is bullish or bearish overall. It acts as a key reference point for longer-term trend followers, helping them stay with the broader market sentiment.
Conclusion:
From a supply and demand perspective, the 7, 25, and 99-period moving averages help traders visualize shifts in the balance between buyers and sellers over different time horizons. The price action interaction with these moving averages provides valuable insight into short-term momentum, intermediate trends, and long-term market sentiment. Using these three MAs together gives a more comprehensive understanding of market conditions, helping traders align their strategies with prevailing trends across various timeframes.
------------- RULE BASED SYSTEM ---------------
Overview of the Rule-Based System:
This system will use the following moving averages:
7-period MA: Represents short-term price action.
25-period MA: Represents medium-term price action.
99-period MA: Represents long-term price action.
1. Trend Identification Rules:
Bullish Trend:
The 7-period MA is above the 25-period MA, and the 25-period MA is above the 99-period MA.
This structure shows that short, medium, and long-term trends are aligned in an upward direction, indicating strong bullish momentum.
Bearish Trend:
The 7-period MA is below the 25-period MA, and the 25-period MA is below the 99-period MA.
This suggests that the market is in a downtrend, with bearish momentum dominating across timeframes.
Neutral/Consolidation:
The 7-period MA and 25-period MA are flat or crossing frequently with the 99-period MA, and they are close to each other.
This indicates a sideways or consolidating market where there’s no strong trend direction.
2. Entry Rules:
Bullish Entry (Buy Signals):
Primary Buy Signal:
The price crosses above the 7-period MA, AND the 7-period MA is above the 25-period MA, AND the 25-period MA is above the 99-period MA.
This indicates the start of a new upward trend, with alignment across the short, medium, and long-term trends.
Pullback Buy Signal (for trend continuation):
The price pulls back to the 25-period MA, and the 7-period MA remains above the 25-period MA.
This indica
tes that the pullback is a temporary correction in an uptrend, and buyers may re-enter the market as price approaches the 25-period MA.
You can further confirm the signal by waiting for price action (e.g., bullish candlestick patterns) at the 25-period MA level.
Breakout Buy Signal:
The price crosses above the 99-period MA, and the 7-period and 25-period MAs are also both above the 99-period MA.
This confirms a strong bullish breakout after consolidation or a long-term downtrend.
Bearish Entry (Sell Signals):
Primary Sell Signal:
The price crosses below the 7-period MA, AND the 7-period MA is below the 25-period MA, AND the 25-period MA is below the 99-period MA.
This indicates the start of a new downtrend with alignment across the short, medium, and long-term trends.
Pullback Sell Signal (for trend continuation):
The price pulls back to the 25-period MA, and the 7-period MA remains below the 25-period MA.
This indicates that the pullback is a temporary retracement in a downtrend, providing an opportunity to sell as price meets resistance at the 25-period MA.
Breakdown Sell Signal:
The price breaks below the 99-period MA, and the 7-period and 25-period MAs are also below the 99-period MA.
This confirms a strong bearish breakdown after consolidation or a long-term uptrend reversal.
3. Exit Rules:
Bullish Exit (for long positions):
Short-Term Exit:
The price closes below the 7-period MA, and the 7-period MA starts crossing below the 25-period MA.
This indicates weakening momentum in the uptrend, suggesting an exit from the long position.
Stop-Loss Trigger:
The price falls below the 99-period MA, signaling the breakdown of the long-term trend.
This can act as a final exit signal to minimize losses if the long-term uptrend is invalidated.
Bearish Exit (for short positions):
Short-Term Exit:
The price closes above the 7-period MA, and the 7-period MA starts crossing above the 25-period MA.
This indicates a potential weakening of the downtrend and signals an exit from the short position.
Stop-Loss Trigger:
The price breaks above the 99-period MA, invalidating the bearish trend.
This signals that the market may be reversing to the upside, and exiting short positions would be prudent.

Multi Deviation VWAP [OmegaTools]The Multi Deviation VWAP is an original variation of the traditional VWAP indicator, designed to enhance your trading experience by providing more precise market insights. While the conventional VWAP calculates a single price level based on volume and price over a given period, the Multi Deviation VWAP goes a step further by introducing dynamic upper and lower bands that adapt to market conditions. These bands give traders a more comprehensive understanding of volatility and price action, making it an ideal tool for various trading strategies, especially for identifying potential price reversals or trend continuations.
Key Features:
Separate Calculation of Deviation Bands:
Unlike traditional VWAP bands, where both the upper and lower bands are symmetrically calculated using a single deviation value, the Multi Deviation VWAP calculates the deviations independently for the upper and lower bands. This allows for a more accurate reflection of market dynamics.
The upper deviation band is based on the average distance of closing prices above the VWAP, while the lower deviation band considers the average distance of closing prices below the VWAP.
This separation provides a more tailored approach, adapting to whether the market is showing bullish or bearish momentum, as opposed to a fixed, equal deviation in both directions.
Internal and External Bands:
Two sets of deviation bands are plotted: Internal Bands and External Bands, controlled by user inputs (factorone for internal and factortwo for external). These bands offer multiple levels of support and resistance based on market volatility.
The Internal Bands are closer to the VWAP and act as the first level of support/resistance, suitable for short-term or tighter trading ranges.
The External Bands are further from the VWAP and capture more significant market swings, useful for identifying larger trends or setting wider stop-losses.
Timeframe Flexibility:
The indicator allows traders to select the desired timeframe (1D by default) over which the VWAP and its deviation bands are calculated. This flexibility enables users to adapt the indicator to different trading styles, from intraday scalping to longer-term trend analysis.
Visual Enhancements:
Bullish and Bearish Colors: The bands are color-coded for quick visual interpretation. Bullish bands (lower deviations) are colored blue, while bearish bands (upper deviations) are colored red, making it easy to differentiate between market conditions at a glance.
Plot Fill: The area between the internal and external bands is shaded, providing clear visual zones of potential price containment, aiding in understanding the market structure and anticipating price movements.
How It Differs from a Standard VWAP:
Traditional VWAP provides a single price line that represents the volume-weighted average price over a given period, often used to identify general price trends.
In contrast, the Multi Deviation VWAP introduces upper and lower bands calculated separately based on price deviations above and below the VWAP, giving a more nuanced view of market volatility.
Symmetrical bands in traditional VWAP may not always accurately reflect the market's true behavior, especially in trending markets, where upward and downward price movements aren't always equal. By splitting the deviation calculations, this tool provides a more dynamic and realistic view of price action, adapting to whether the market is showing stronger upward or downward pressure.
Use Cases:
Trend Identification: The VWAP line acts as a central trend line, while the deviation bands offer levels of potential support and resistance. When price moves beyond the external bands, it may indicate overextension and potential reversal.
Volatility Trading: Traders can use the internal and external bands to set dynamic take-profit or stop-loss levels, allowing for flexible risk management depending on market conditions.
Range Trading: In consolidating markets, the Multi Deviation VWAP can help traders identify optimal buy and sell zones as the price oscillates between the upper and lower bands.
By incorporating independent deviation bands, this indicator provides traders with a more responsive tool that reflects market behavior more accurately, helping them make informed trading decisions with enhanced precision.
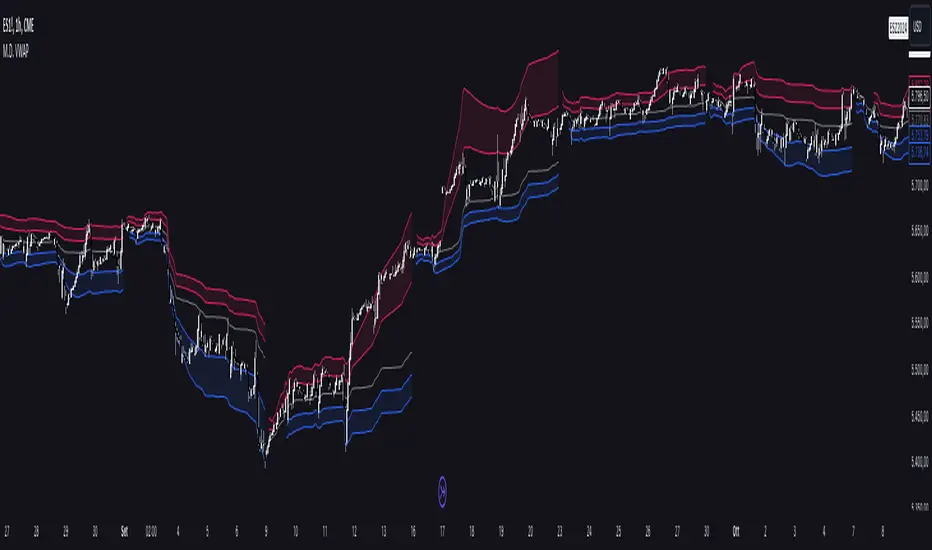
Manoj Personal EMA 5-203 EMA Trading Strategy Script Overview:
EMAs Used:
5 EMA: Short-term moving average.
20 EMA: Medium-term moving average.
564 EMA: Long-term moving average to identify overall trend direction.
Entry Signals:
Strong Buy: Triggered when:
Price is above the 564 EMA (uptrend).
The 5 EMA crosses above the 20 EMA (bullish crossover).
The current candle is green (close > open).
Strong Sell: Triggered when:
Price is below the 564 EMA (downtrend).
The 5 EMA crosses below the 20 EMA (bearish crossover).
The current candle is red (close < open).
Exit Signal:
Position is closed when the price touches back to the 564 EMA (either side, up or down):
A "Close Position" label is shown in green for long trades.
A "Close Position" label is shown in red for short trades.
Risk Management:
Stop-Loss: Placed at the last swing low (for longs) or last swing high (for shorts), calculated over the last 10 bars.
Take-Profit: A 1:3 risk/reward ratio is used, where the potential reward is three times the risk.
Alerts:
Alerts are triggered for buy and sell signals.
Alerts are also triggered when the exit condition (price touching the 564 EMA) is met.
This script is designed to work on timeframes of 15 minutes or higher but can also be used for 5-minute scalping. It plots the EMAs on the chart, highlights buy/sell opportunities, shows stop-loss and take-profit levels, and generates alerts for key signals.
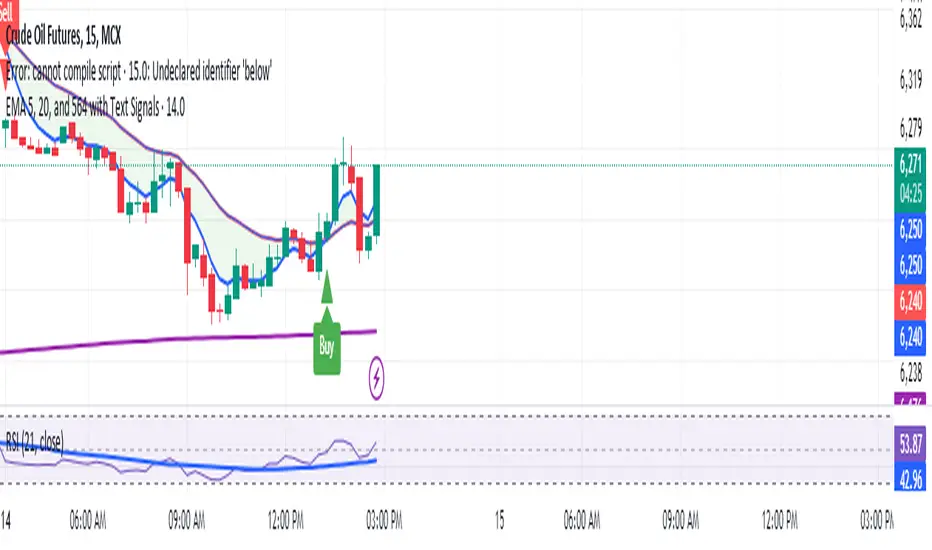
Parabolic SAR Crosses_AITIndicator Name: Parabolic SAR Crosses_AIT
Purpose:
This indicator utilizes the Parabolic SAR to track price trends and generate buy (long) and sell (short) signals when the price crosses the Parabolic SAR line. The indicator is designed to help traders identify trend direction and potential trend reversals on the price chart.
Indicator Overview:
Indicator Parameters:
Parabolic SAR: The default settings for the Parabolic SAR are:
Step: 0.02
Maximum: 0.2 These values can be adjusted by the user to control the sensitivity of the SAR.
Signal Conditions:
Buy Signal (Long): A buy signal is generated when the price crosses above the Parabolic SAR line.
Sell Signal (Short): A sell signal is generated when the price crosses below the Parabolic SAR line.
How It Works:
Buy Signal:
When the price crosses above the Parabolic SAR line, it indicates a potential upward trend. A yellow triangle (L) will appear below the price bar, signaling a possible long entry.
Sell Signal:
When the price crosses below the Parabolic SAR line, it indicates a potential downward trend. A fuchsia triangle (S) will appear above the price bar, signaling a possible short entry.
Trend Detection:
Green Line: Indicates that the Parabolic SAR is below the price, suggesting an uptrend.
Red Line: Indicates that the Parabolic SAR is above the price, suggesting a downtrend.
Trend Reversal:
A trend reversal occurs when the Parabolic SAR switches positions relative to the price. This can be used to exit positions or enter positions in the opposite direction.
Customization:
Step Size: The step parameter controls how sensitive the Parabolic SAR is to price changes. A smaller step value (e.g., 0.01) makes the SAR less sensitive, while a larger step value (e.g., 0.05) makes it more sensitive.
Maximum: The maximum value defines the upper limit for the acceleration factor in the SAR calculation. A higher value allows the SAR to track the price more closely, while a lower value smooths the trend.
Visual Representation:
The Parabolic SAR line is plotted directly on the price chart as a solid line, using the appropriate colors (green or red) depending on the trend direction.
Long signals are indicated by small yellow triangles (L) below the price.
Short signals are indicated by small fuchsia triangles (S) above the price.
Usage Tips:
Combining with Other Indicators: While Parabolic SAR is a great tool for identifying trend direction, it may produce false signals in ranging or sideways markets. Combining this indicator with other trend confirmation tools, such as moving averages or the MACD, can improve its reliability.
Adjusting the Step and Maximum Values: In highly volatile markets, it might be useful to reduce the step value to avoid false signals. In more stable, trending markets, increasing the step value can make the SAR more responsive.
Position Management: Parabolic SAR can be used not only to enter trades but also to manage existing positions by acting as a trailing stop-loss. You can use the SAR value as a dynamic stop-loss level, adjusting it as the trend progresses.
Conclusion:
The Parabolic SAR Crosses_AIT indicator helps traders visually identify trend directions and possible trend reversals by plotting the Parabolic SAR directly on the price chart. With customizable settings for sensitivity and signals that indicate long or short positions, this indicator provides a clear and effective method to manage trades based on trend-following strategies.

Position Sizer by VolatilityDescription :
The **Position Sizer by Volatility (PSV)** is an indicator that helps traders determine what percentage of their deposit a position will occupy, taking into account the current market volatility. PSV calculates the range of price movements over recent periods and shows how large this movement is compared to historical data. The lower the value, the lower the volatility, and the smaller the stop-loss required relative to the current price.
Explanation of PSV Parameters:
- ` len ` (Period Length):** This parameter sets the number of candles (bars) on the chart that will be used to calculate volatility. For example, if `len` is set to 250, the indicator will analyze price movements over the last 250 bars. The larger the value, the longer the period used for volatility assessment.
- ` percent ` (Percentile):** This parameter determines how strong price fluctuations you want to account for. For instance, if you set `percent` to 95, the indicator will focus on the 5% of instances where the price range was the largest over the specified period. This helps evaluate volatility during periods of sharp price movements, which may require a larger stop-loss. A higher percentile accounts for rarer but stronger movements, and vice versa.
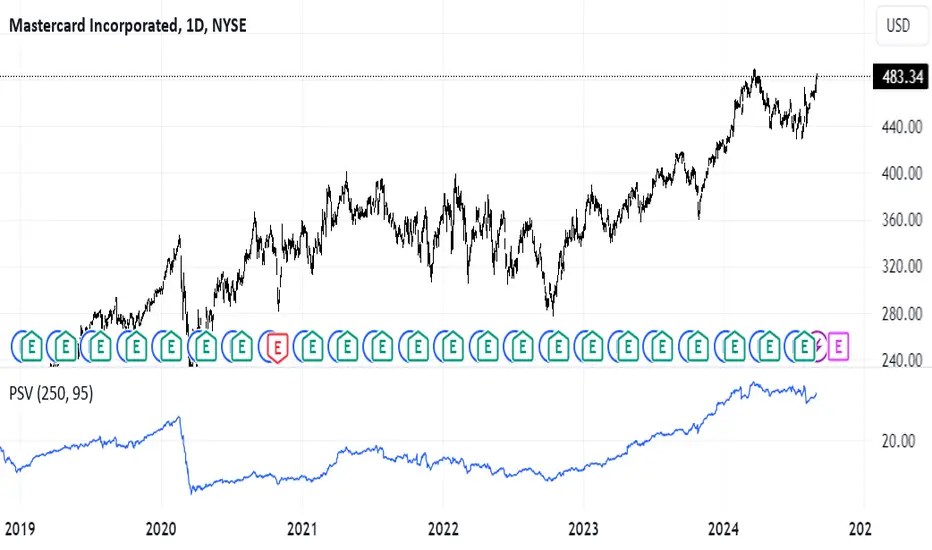
Bat Harmonic Pattern [TradingFinder] Bat Chart Indicator🔵 Introduction
The Bat Harmonic Pattern, created by Scott Carney in the 1990s, is a sophisticated tool in technical analysis, used to identify potential reversal points in price movements by leveraging Fibonacci ratios.
This pattern is classified into two primary types: the Bullish Bat Pattern, which signals the end of a downtrend and the beginning of an uptrend, and the Bearish Bat Pattern, which indicates the conclusion of an uptrend and the onset of a downtrend.
🟣 Bullish Bat Pattern
The Bullish Bat Pattern is designed to identify when a downtrend is likely to end and a new uptrend is about to begin. The key feature of this pattern is Point D, which typically aligns near the 88.6% Fibonacci retracement of the XA leg.
This point is considered a strong buy zone. When the price reaches Point D after a significant downtrend, it often indicates a potential reversal, presenting a buying opportunity for traders anticipating the start of an upward movement.
🟣 Bearish Bat Pattern
In contrast, the Bearish Bat Pattern forms when an uptrend is nearing its conclusion. Point D, which also typically aligns near the 88.6% Fibonacci retracement of the XA leg, serves as a critical point for traders.
This point is regarded as a strong sell zone, signaling that the uptrend may be ending, and a downtrend could be imminent. Traders often open short positions when they identify this pattern, aiming to capitalize on the anticipated downward movement.
🔵 How to Use
The Bat Pattern consists of five key points: X, A, B, C, and D, and four waves: XA, AB, BC, and CD. Fibonacci ratios play a crucial role in this pattern, helping traders pinpoint precise entry and exit points. In both the Bullish and Bearish Bat Patterns, the 88.6% retracement of the XA leg is a critical level for identifying potential reversal points.
🟣 Bullish Bat Pattern
Traders typically enter buy positions after Point D forms, expecting the downtrend to end and a new uptrend to start. This point, located near the 88.6% retracement of the XA leg, serves as a reliable buy signal.
🟣 Bearish Bat Pattern
Traders usually open short positions after identifying Point D, expecting the uptrend to end and a downtrend to begin. This point, also near the 88.6% retracement of the XA leg, acts as a valid sell signal.
🟣 Trading Tips for the Bat Pattern
Accurate Fibonacci Point Identification : Accurately identify Points X, A, B, C, and D, and calculate the Fibonacci ratios between these points. Point D should ideally be near the 88.6% retracement of the XA leg.
Signal Confirmation with Other Tools : To enhance the pattern's accuracy, avoid trading solely based on the Bat Pattern.
Risk Management : Always use stop-loss orders. In a Bullish Bat Pattern, place the stop-loss below Point X, and in a Bearish Bat Pattern, above Point X. This helps limit potential losses if the pattern fails.
Wait for Price Movement Confirmation : After identifying Point D, wait for the price to move in the anticipated direction to confirm the pattern's validity before entering a trade.
Set Realistic Profit Targets : Use Fibonacci retracement levels to set realistic profit targets, such as 38.2%, 50%, and 61.8% retracement levels of the CD leg. This strategy helps maximize profits and prevents premature exits.
🔵 Setting
🟣 Logical Setting
ZigZag Pivot Period : You can adjust the period so that the harmonic patterns are adjusted according to the pivot period you want. This factor is the most important parameter in pattern recognition.
Show Valid Forma t: If this parameter is on "On" mode, only patterns will be displayed that they have exact format and no noise can be seen in them. If "Off" is, the patterns displayed that maybe are noisy and do not exactly correspond to the original pattern.
Show Formation Last Pivot Confirm : if Turned on, you can see this ability of patterns when their last pivot is formed. If this feature is off, it will see the patterns as soon as they are formed. The advantage of this option being clear is less formation of fielded patterns, and it is accompanied by the latest pattern seeing and a sharp reduction in reward to risk.
Period of Formation Last Pivot : Using this parameter you can determine that the last pivot is based on Pivot period.
🟣 Genaral Setting
Show : Enter "On" to display the template and "Off" to not display the template.
Color : Enter the desired color to draw the pattern in this parameter.
LineWidth : You can enter the number 1 or numbers higher than one to adjust the thickness of the drawing lines. This number must be an integer and increases with increasing thickness.
LabelSize : You can adjust the size of the labels by using the "size.auto", "size.tiny", "size.smal", "size.normal", "size.large" or "size.huge" entries.
🟣 Alert Setting
Alert : On / Off
Message Frequency : This string parameter defines the announcement frequency. Choices include: "All" (activates the alert every time the function is called), "Once Per Bar" (activates the alert only on the first call within the bar), and "Once Per Bar Close" (the alert is activated only by a call at the last script execution of the real-time bar upon closing). The default setting is "Once per Bar".
Show Alert Time by Time Zone : The date, hour, and minute you receive in alert messages can be based on any time zone you choose. For example, if you want New York time, you should enter "UTC-4". This input is set to the time zone "UTC" by default.
🔵 Conclusion
The Bat Harmonic Pattern is a powerful tool in technical analysis, offering traders the ability to identify critical reversal points using Fibonacci ratios. By recognizing the Bullish and Bearish Bat Patterns, traders can anticipate potential trend reversals and make informed trading decisions.
However, it is essential to combine the Bat Pattern with other technical analysis tools and confirm signals for better trading outcomes. With proper use, this pattern can help traders minimize risk and optimize their entry and exit points in the market.

Three Drive Pattern Detector [LuxAlgo]The Three Drives Pattern Detector indicator focuses on detecting and displaying completed Three Drives patterns on the user chart. This harmonic pattern is characterized by successive higher highs / lower lows following specific ratios.
The script uses a multi-length swing detection approach, as well as adjusting ratios to ensure flexibility and a maximum number of visible Three Drives patterns.
🔶 USAGE
The bullish/bearish Three Drives pattern is commonly interpreted as a reversal pattern and is characterized by three extensions (drives) and two intermediary retracements creating consecutive higher lows (for a bullish case) or lower highs (for a bearish case).
The multi-length swing detection approach taken by the indicator allows for detecting shorter-term alongside medium/longer-term patterns simultaneously, allowing to increase in the amount of detected patterns.
Users can set a Minimum Swing length (for example 2) and a Maximum Swing length (for example 100) which defines the range of the swing point detection length, higher values for these settings will detect longer-term Three-Drives patterns, while a larger range will allow for the detection of a larger number of patterns.
Sometimes multiple dashed lines as the last segment can be observed. This means multiple Three Drives patterns sharing multiple swing points have formed, with only the last segment being different.
🔹 Retracement/Extension Ratios
The Three Drives pattern often associates the retracement/extension to Fibonacci ratios of respectively 0.618/1.272.
Some sources specify a maximum retracement/extension level of 0.786/1.618, which means the retracement should be within the 0.618-0.786 range and the extension between 1.272-1.618.
Since finding a pattern where the retracement/extension is precisely at the 0.618/1.272 levels, or even between 0.618-0.786/1.272-1.618 is rare, the script allows users to adjust those ratios, which ensures more flexibility. Depending on the widening/tightening of the ratios, allowing users to find more patterns (but potentially less valid) or more valid (but fewer patterns).
In the example above, " Show Ratios " is set to " Ratios With Margin ", showing the ideal retracement/extension level together with the margin, while in the example below, " Show Ratios " is set to " Ratios ", which shows only a line where the price should ideally reverse.
While setting the ratios wider will result in more frequent but less valid patterns, it can also create good trading opportunities.
🔹 Best Practices
The indicator doesn't include Stop Loss (SL) or Take Profit (TP) levels, however, the 1.618 Fibonacci Extension level of the last leg can commonly be used as stop loss.
Typical Take Profit areas include:
Starting point of the pattern
Each retracement level (2x)
The 0.618 retracement level of the complete pattern
In the above bullish examples, the price was lower than the lowest point of the pattern. The price reversed and attained all TP levels without hitting the SL level.
In the above bearish example, the price went above the highest point of the pattern but did not hit the SL level, after which two TP levels were hit. Then, the price quickly went up, just missing the SL level before it came back down again, hitting the last 2 TP levels.
This example shows that other Fibonacci levels an also be effective when combined with the Three Drives pattern, even in the longer term.
🔶 DETAILS
🔹 Multi Length
The core of this publication is the multi-length swing detection. To ensure the maximum amount of Three Drives patterns are found, up to 99 different swing length periods can be used to detect swing points which are then tested for valid patterns.
Using a wider variety of swing points also ensures that patterns visible only with specific Swing settings can be found on the same chart without the user needing to constantly adjust the Swing settings to find other patterns.
The user only needs to set the desired minimum and maximum Swing Length.
In this case, swing detection using swing Lengths from 3 to 100 (97 different) are computed and evaluated for patterns. Three different patterns were found on the same chart, with swing lengths 3, 4, and 6.
Note: The Maximum Swing length should be equal to or higher than the Minimum Swing Length . If the maximum value is lower than the minimum, the script will automatically take the minimum value as the maximum to prevent errors.
🔹 Width Margin %
Users can filter out patterns based on the duration of each extension/retracement segment. When the users want segments of the detected patterns to be of a similar duration, the width percentage should be set lower. When the focus is on detecting more patterns the width percentage can be set higher.
🔹 Retracement/Extension Settings
Show Ratios , set to Ratios , show the ideal Fibonacci retracement/extension level, while Ratios With Margin (example below) show the additional margins for retracement/extension.
The upper and lower limits can be visualized while hovering over the calculated ratio label.
The dashed line shows an older pattern, where the last leg has been updated.
🔹 Last Known Pattern
The included dashboard highlights the date of the most recently detected pattern; the text will show " None " if no pattern is found.
🔹 Calculated Bars
The "Calculated Bars" setting makes use of the recently introduced calc_bars_count parameter, making it possible to effectively reduce the number of historical bars during the computation of the script, which significantly improves the loading speed of the script.
Users wishing to see the most recent patterns can set this setting to 1000 for example, where only the most recent 1000 bars are used to find patterns. If every bar must be used for pattern detection, set " Calculated bars " at 0.
🔶 SETTINGS
Minimum Swing Length: Minimum length used for the swing detection.
Maximum Swing Length: Maximum length used for the swing detection.
Retracement: Range of required ratios used for testing retracements.
Extension: Range of required ratios used for testing extensions.
Width Margin: Influences the symmetry of the pattern; with a higher number allowing for less symmetry.
🔹 Style
Text Size: Text size of the ratio labels.
Show Ratios: Show the ideal ratio, upper/lower limit of ratios, or none.
🔹 Dashboard
Show Dashboard: Toggle dashboard which shows the date of the last found pattern.
Location: Location of the dashboard on the chart.
Size: Text size.
🔹 Calculation
Calculated Bars: Allows the usage of fewer bars for performance/speed improvement.
